In the pharmaceutical, food, and chemical industries, product stability is paramount.
Ensuring that a product maintains its quality, potency, and safety over its intended shelf life is critical for both consumer safety and business success. Stability studies, meticulously designed and executed, provide the data necessary to understand a product’s behavior under various storage conditions and over time. However, raw data alone tells only part of the story. The true power of stability studies lies in the application of robust statistical methods, which allow us to analyze trends, predict shelf life, identify potential failure points, and ultimately, make informed decisions about product formulation, packaging, and storage. This article will delve into the essential statistical tools employed as part of the digitalization of the stability study management and testing processes in the medical product industry that significantly enhances the easy and effective statistical analysis of drug stability data.
Key Definitions
Digitize – convert (data, pictures, text, or sound) into a digital form that can be processed by a computer.
Digitalization – adaptation of a system, process, etc. to be operated with the use of computers and the internet; a strategy or process of utilizing digital technologies, resulting in increased efficiency.
Medical Product Stability Statistics
When assembling a Stability Program, right after a QC laboratory and stability chambers, a Statistics plan would be high on our list. Whether we have one now, contract it out or are planning for the future, a Statistics program is worthy of our close attention. Are we compliant with ICH Q1E? Do we have a sound plan and procedures for timely generation and analysis of data? What are the statistical “off-ramps” into problem areas? Are our reports making the case for believable shelf lives with regulatory authorities?
Let’s take a deeper dive into the intricate world of statistics for medical product stability, including requirements from ICH Q1E, Industry Best Practices and potential pitfalls.
ICH Q1E and its Significance
The International Council for Harmonisation of Technical Requirements for Pharmaceuticals for Human Use (ICH) plays a pivotal role in standardizing guidelines for the pharmaceutical industry. ICH Q1E specifically addresses the statistical evaluation of stability data. The primary goal is to establish a framework that ensures the reliability of stability information, leading to better decision-making regarding the shelf life and storage conditions of pharmaceutical products. While it’s the current gold standard for requirements, it follows the typical Guidance convention and does not get into specifics as to how to get there. We should be able to trace the starting point of our stats programs and procedures back to the requirements of ICH Q1E. This would be valuable during an inspection as the basis of, and justification for, our practices and policies.
Digitalization of the Stability Study Management and Data Analysis
The digitalization of managing stability studies is revolutionizing the way the pharmaceutical industry stores and analyzes data. Traditional methods of stability testing often involved labor-intensive processes, with data stored across various formats and systems, leading to inefficiencies and potential for errors. By integrating into a single digitalized platform, pharmaceutical companies can streamline the acquisition, verification and approval, and finally the analysis of stability data, thus improving accuracy and reliability of the statistical analysis and accelerating the decision-making.
One of the significant benefits of digitalization is the integration of statistical analysis within the same system that houses the test results. This consolidated approach eliminates the need for manual data transfers between separate systems, reducing the probability of human error and ensuring data consistency. It enables researchers to conduct advanced statistical analyses on stability data more effectively, allowing for quicker detection of trends and potential issues. Additionally, having statistical tools directly integrated in the same system as the raw test data streamlines regulatory reporting, improves compliance, and enhances the overall quality control process. By combining data collection and analysis in a single digitalized ecosystem, pharmaceutical companies can ensure more robust and accurate stability study outcomes, ultimately benefiting both drug producers and patients.
Unfortunately, even today, many companies still don’t have a digitalized system with the statistical analysis tools built in, analysis can only occur if they export to an external system, and in many cases the export operation and the system itself are not validated. Exporting data from a validated Stability Study Management System to an external, unvalidated system poses significant quality and regulatory risks. Validation ensures data integrity, accuracy, and compliance with industry regulations such as FDA 21 CFR Part 11 and Good Laboratory Practices (GLP). When data is exported to an unvalidated system, there is no assurance that it will maintain its original format, traceability, or accuracy. The lack of system controls in the external platform can lead to data corruption, loss, or unauthorized modifications, compromising the reliability of critical quality and compliance-related records.
Regulatory agencies mandate that electronic records remain secure, traceable, and unaltered throughout their lifecycle. An invalidated system lacks proper security controls, user access restrictions, and audit trail functionalities, making it vulnerable to unauthorized changes whether intentional or not. Further, if data is used for decision-making in an unvalidated system, its integrity cannot be assured, leading to incorrect outcomes that could impact quality decisions. The best approach to mitigate these risks is to have a single platform in which the data is housed and analysed; a validated system which meets regulatory requirements for data integrity and security.
Consequences – Lack of Statistical Tools Means Lack of Analysis
Some of the consequences of not having the requisite statistical tools built in are:
- Lack of Trending
- Lack of approved statistical methods
- Incomplete investigations
- Erroneous shelf-life prediction
- Missing comparability opportunities
- Incorrect data pooling
Ultimately, not having the correct statistical tools to analyze medical product stability study data can lead to inaccurate estimations of a drug’s shelf life, potency, and degradation profile. Without the appropriate statistical methods, for example, regression analysis, confidence interval estimation, and outlier detection, the data may be misinterpreted, resulting in incorrect expiration dating and unsuitable storage conditions. This could lead to patients receiving medications that are either ineffective due to degradation or potentially harmful due to the formation of toxic byproducts. Additionally, unreliable stability predictions can disrupt production schedules and inventory management, leading to supply chain inefficiencies and financial losses for pharmaceutical companies.
From a regulatory perspective, incorrect statistical analysis can result in non-compliance with guidelines set by authorities such as the FDA and ICH. Stability studies must provide scientifically justified and reproducible data to support drug approval and post-market monitoring. If statistical errors lead to questionable stability claims, regulatory agencies may reject submissions, require costly additional studies, or issue warning letters that delay product launches. In severe cases, improper stability data analysis could lead to product recalls, legal consequences, and damage to a company’s reputation. Ensuring the use of validated and appropriate statistical tools is essential for maintaining compliance, ensuring product quality, and ultimately protecting patient safety.
Digitalization Means Good Statistics Telling Good Stories
What product story do I want to tell and what statistical tools do I need to build into my digitalized Stability data management system to tell it?
Stability statistics serve as the cornerstone for evaluating the robustness of medical products over time. Key components include summary statistics, which offer a snapshot of central tendencies and variabilities in data. Graphical representations, such as degradation profiles and time plots, provide a visual understanding of stability trends. Statistical models, often in the form of regression analyses, contribute to predicting future stability outcomes based on historical data. Additionally, the inclusion of outlier analysis and confidence intervals enhances the comprehensiveness of these reports. Various types of investigations (OOS, OOT, etc.) are prime candidates for statistical elucidation as well1.
Trends on Results
In essence, you’re looking for individual data points that break the rules, and for broader patterns that indicate the product is changing in an undesirable way over time, and at what point the product change is so great that it is no longer effective. When looking at individual points, some of the criteria to look at includes the percentage variation from the initial time point result; this can indicate a significant change although the result itself still meets with the acceptance criteria specification. Change to the degradation rate can be indicated by a significant percentage change from the previous data point, this rapid increase/decrease in the rate of change of any parameter can indicate an adverse trend. These single results, and variation in result to result trends can be visually highlighted at the result entry point by color coding, and can be notified as part of email alerts when a defined rule has been broken or a high rate of change has been detected.
Trends on Plotted Results
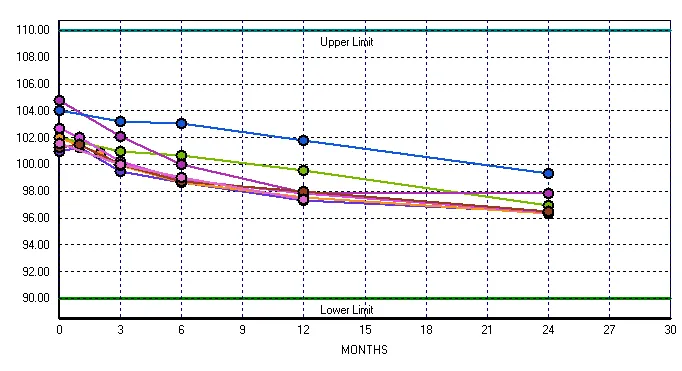
When visualizing stability data, a scatter plot is a powerful tool for comparing current test results with historical data. By plotting time points on the x-axis and results on the y-axis, individual data points from current and previous studies are displayed together, this facilitates a clear visual comparison of trends. Prior stability data will establish a clear trend representing the expected behavior of the product over time. New results can be compared to existing patterns reinforcing the degradation rate or those showing a deviation from the expected pattern.

Scatter plots also support the identification of outliers and variations from batch to batch. Overlaying data from multiple previous batches in one color, and the new batch in a different color, provides a clear batch to batch assessment of variability. The scatter plot serves as a valuable tool for quickly identifying potential adverse trends and ensuring the ongoing stability of the pharmaceutical product.
Regression Analysis
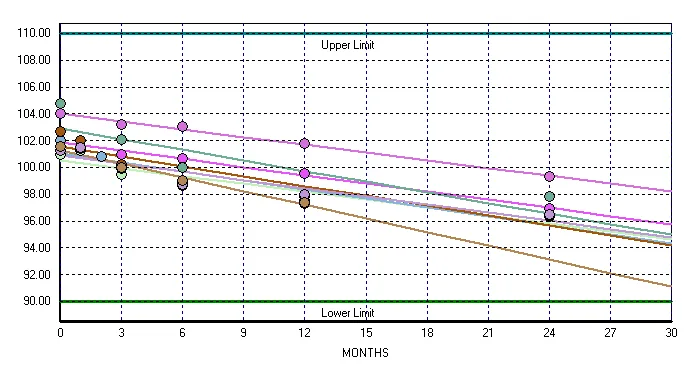
Regression analysis plays a crucial role in pharmaceutical stability studies, primarily for determining the shelf life of drug products. Regression analysis is used to model the relationship between time and the degradation of key quality attributes of the drug product (e.g., concentration of the active ingredient).By analyzing stability data, regression models can predict how these attributes will change over time. Once a regression model is established, it can be used to extrapolate and estimate the time at which the drug product’s quality falls outside acceptable limits. This estimated time becomes the basis for determining the product’s shelf life.
Regression analysis helps identify trends in the stability data, such as linear or non-linear degradation patterns. This allows pharmaceutical scientists to understand the mechanisms of degradation and optimize storage conditions.Regression analysis is also used to identify “Out of trend” data points. These are data points that deviate significantly from the predicted regression line. Identifying these points is important to determine if they are caused by analytical errors, or if they represent a real change in the stability of the product.
Multiple Regression / p-value Analysis
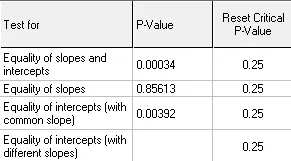
Multiple regression is a statistical technique used to model the relationship between a dependent variable and multiple independent variables. In the context of data pooling for stability studies and shelf-life prediction, multiple regression helps analyze how different factors affect the degradation rate of a product. By pooling data from different batches a more comprehensive predictive model can be developed. This approach enhances the accuracy of shelf-life estimation by accounting for variability across multiple datasets, rather than relying on a single dataset that may not capture the full range of influencing factors.

P-value analysis in multiple regression is crucial for determining the significance of each independent variable in predicting shelf life. A low p-value (typically <0.05) indicates that the variable has a statistically significant impact on the dependent variable, such as drug potency over time. In stability studies, p-value analysis helps identify the most critical factors influencing product degradation and ensures that only meaningful predictors are included in the final model. This improves the reliability of shelf-life predictions, allowing regulatory agencies and manufacturers to make data-driven decisions about storage conditions, expiration dates, and product quality over time.

ANOVA
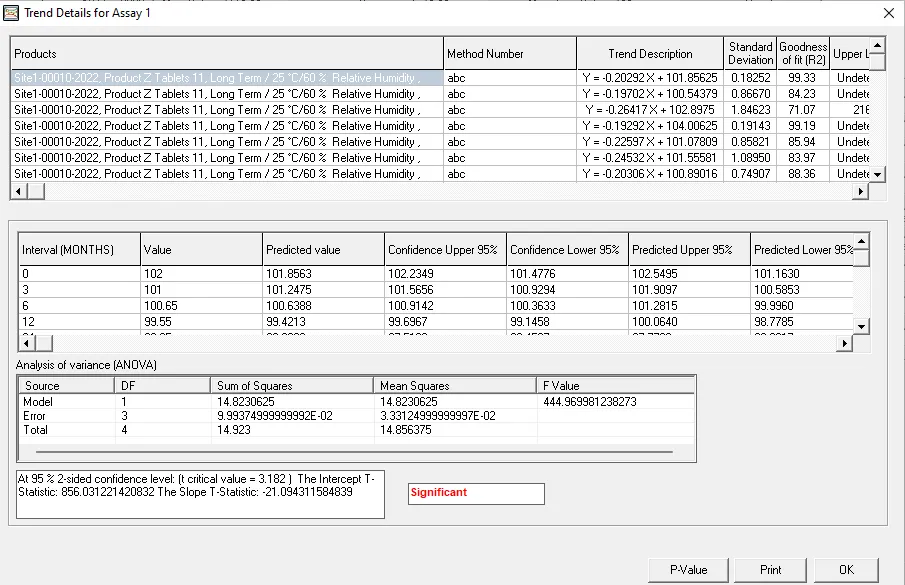
Analysis of variance (ANOVA) is a statistical test used to assess the difference between the means of more than two groups. At its core, ANOVA allows you to simultaneously compare arithmetic means across groups. You can determine whether the differences observed are due to random chance or if they reflect genuine, meaningful differences.
- A one-way ANOVA uses one independent variable. A two-way ANOVA uses two independent variables.
- By partitioning total variance into components, ANOVA unravels relationships between variables and identifies true sources of variation.
- ANOVA can handle multiple factors and their interactions, providing a robust way to better understand intricate relationships2.

Arrhenius Equation
The Arrhenius equation is another tool for predicting the degradation rate of several categories of drug products under varying temperatures, ultimately helping to determine their shelf life. Because long-term storage at typical room temperatures can take years, stability studies often involve storing drug samples at elevated temperatures. By measuring the degradation rate at these higher temperatures, and applying the Arrhenius equation, researchers can extrapolate and estimate the degradation rate at lower, more realistic storage conditions.
This methodology is crucial for accelerating the stability testing process, saving time and resources while still providing reliable data. That said, the Arrhenius equation can’t be used when dealing with heterogeneous catalysis, reactions showing Langmuir-Hinshelwood kinetics, or during the glass transition in all classes of glass-forming matter where deviations from the Arrhenius law occur. In some categories, scientists have developed more appropriate predictive models to accommodate the unique differences in the characteristics of various products. Included in these is the Isoconversion method often represented by the commercial program-ASAPprime developed by FreeThink Technologies3.
Similarity; what is similar and of statistical value between products?
- Is there statistical similarity/comparability of different [scales, formulations, presentations, etc.]?
- Is there statistical similarity of manufacturing sites?
- Is there statistical justification for a bracketing / matrixing strategy?
Summary – A Comprehensive Solution through Digitalization
Technology can substantially mitigate the risks of omitted trending, lack of approved statistical methods, incomplete investigations, erroneous shelf life prediction, missing comparability opportunities and others as well. Managing the Stability data and processes through digitalization is a must have in this day and age where data integrity and process control are critical. The key thing to remember when digitalizing your Stability function is that what goes into the system must also come out. Reporting your data and most importantly using the data for trend analysis with dedicated Stability statistical tools must be carefully planned and engineered. Using codes to label projects, similar formulations, similar packaging, etc. to pull desired groupings into digitalized reports is a must as well as adhering to well-defined procedures as to how these codes are applied. Digitalized systems can significantly enhance statistical analysis but if you have to export your data from your validated system to obtain the requisite statistical output you have selected the wrong system for digitalization.. Join with your IT, Laboratory equipment specialists, statisticians, validation professionals, QA/QC staff, regulatory team and software provider to build the system that best delivers your digitalization objectives.
Building a great digitized stability statistics program, fully delivering all aspects required for product knowledge and project goals and fully compliant with ICH Q1E is a wonderful start but weaving the statistics deliverables into the internal and external product story you want to tell in moving toward regulatory approval can be greatly enhanced through careful implementation of a comprehensive digitalization system. Take the initiative to investigate, plan and secure a system that will accomplish the digitalization you’ll need to stay competitive in the medical product industry.
Now that you are using digitalization you can draw conclusions on the reports and the stats and trends in the system.
References
1Essential Statistics for Stabilitarians KENX Laboratory University 4 – 6 June, 2024 Research Questions for Stability Laura Pack, Sr. Director, CMC Quantitative Sciences Moderna Therapeutics
2What Is Analysis of Variance (ANOVA)? How To Use This Statistical Analysis Tool By Will Kenton Updated July 30, 2024
3FreeThink’s ASAPprime software, https://freethinktech.com/
About the Authors
Susan B. Cleary, B.Cs, EMBA, Director of Product Development – Novatek International
Susan has more than 25 years of experience in designing, developing, implementing, validating, and managing large-scale LIMS (Stability Study dedicated) and Quality Management software projects while working with both Pharmaceutical and Biotech companies to capture their requirements and provide fully validated turnkey digitalized systems. Susan specializes in Laboratory Information Management, Stability Study Management, Environmental Monitoring, and Cleaning Validation processes and works with clients to digitalize their procedures and manage their data more effectively.
John O’Neill, RPh, MS, Editor at StabilityHub
John is a life-long Stabilitarian with 50 years of experience in the medical product industry. His career has taken him from Registered Pharmacist to Liquids and Semi-solids Formulator at Sterling Winthrop, QC Manager at Sanofi-Aventis, Medical Device Quality Steward at Boston Scientific, Independent Consultant, Principal Stability Specialist for Biologics at Genentech, Associate Director for Stability at both Gilead and Regeneron, and is now the founder and editor of stabilityhub.com, an industry information website covering many aspects of the medical product stability function. John is also the founder and facilitator of the Pharmaceutical Stability Discussion Group, an organization dedicated to sharing trends, questions, solutions and experiences related to the stability function
Share This Article with the Stability Community!
February 6, 2026
If you oversee or participate in a medical product Stability program, you have been, or will be involved in an audit or inspection. While inspections [...]
January 11, 2026
So, your Stability Program is underway and/or flourishing. You’re focused on protocols, samples, chambers, disaster planning, testing, data analysis and reports—Each one gobbling up [...]
January 11, 2026
In the tightly regulated world of pharmaceutical, medical device, and biologics manufacturing, contract storage facilities – warehouses or off-site stability storage facilities - play [...]
Share your questions and experiences
A stabilitarian encounters new situations every day. StabilityHub’s discussion forums give Stabilitarians an opportunity to ask questions and offer solutions to specific scenarios. Join in the conversations with other Stabilitiarians and share your knowledge!
A stabilitarian encounters new situations every day. StabilityHub’s discussion forums give Stabilitarians an opportunity to ask questions and offer solutions to specific scenarios. Join in the conversations with other Stabilitiarians and share your knowledge!


