

Pharmaceutical stability studies generate large volumes of data throughout the lifecycle of a drug product. While collecting and managing this information is essential, the real value of stability data comes from the ability to analyze it statistically, identify meaningful trends, compare batches, and determine whether product quality can be expected to remain within specification throughout the proposed shelf life.
There is software that provides an integrated statistical package designed specifically for pharmaceutical stability programs. Rather than transferring stability results into separate spreadsheets or statistical applications, users can perform statistical evaluation directly on controlled stability data within the stability management environment.
The statistical functionality supports the principles described in <strong>ICH Q1E, Evaluation of Stability Data</strong>, including regression analysis, evaluation of batch-to-batch variability, pooling of stability data, confidence limits, and estimation of shelf life or retest periods.
This integrated approach allows stability scientists to move beyond simple pass/fail evaluation and use the complete stability dataset to understand product behavior over time.
Statistical Analysis as Part of the Stability Lifecycle
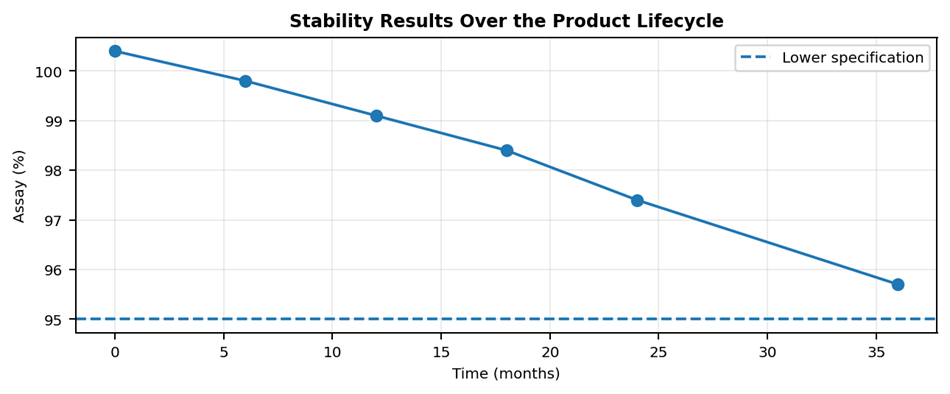
A stability program is fundamentally a longitudinal study. Samples are tested at predefined intervals—such as initial, 3, 6, 9, 12, 18, 24 and 36 months—and the resulting measurements describe how a quality attribute behaves as the product ages.
Some attributes may remain essentially unchanged, while others gradually increase or decrease. Assay may decline, degradation products may increase, dissolution characteristics may change, and physical characteristics may evolve.
Looking at individual results alone does not necessarily reveal whether these changes are significant. A state of the art software program allows the historical results to be evaluated as a time-dependent dataset. Statistical models can be applied to determine whether a measurable trend exists, how rapidly the attribute is changing, and whether that trend could eventually cause the product to reach its specification limit. This provides a much stronger scientific basis for stability evaluation than simply confirming that each individual result currently meets specification.
Regression Analysis
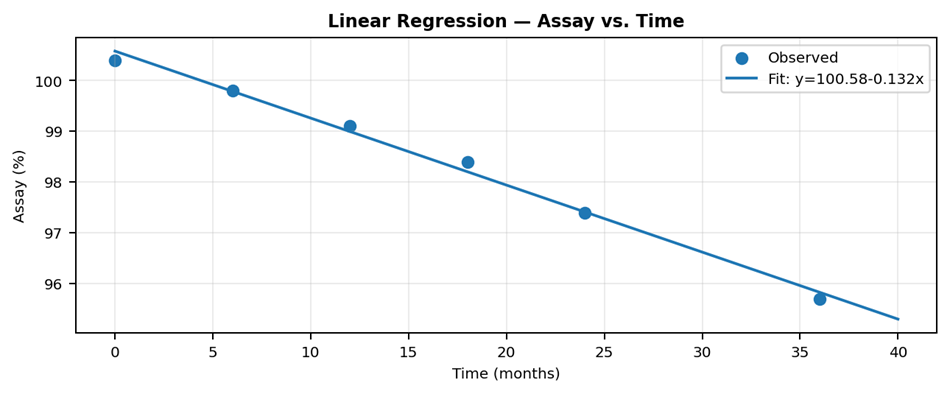
Regression analysis is one of the most important statistical techniques used in pharmaceutical stability evaluation. State of the art software supports the analysis of a stability parameter as a function of time. In a typical linear model, the relationship can be represented as:
<strong>Y = a + bX</strong>
where:
The slope is particularly important because it describes the estimated rate of change of the quality attribute. For example, a negative assay slope may indicate gradual potency loss, while a positive degradation-product slope may indicate the formation of an impurity over time. The statistical analysis allows the observed data points to be evaluated together rather than independently. This provides a quantitative assessment of the direction and magnitude of the stability trend. Regression analysis can therefore help answer an important question:
<strong>Is the product demonstrating a meaningful change with time, and if that change continues, when could the specification limit be reached?</strong>
Shelf-Life and Retest-Period Estimation
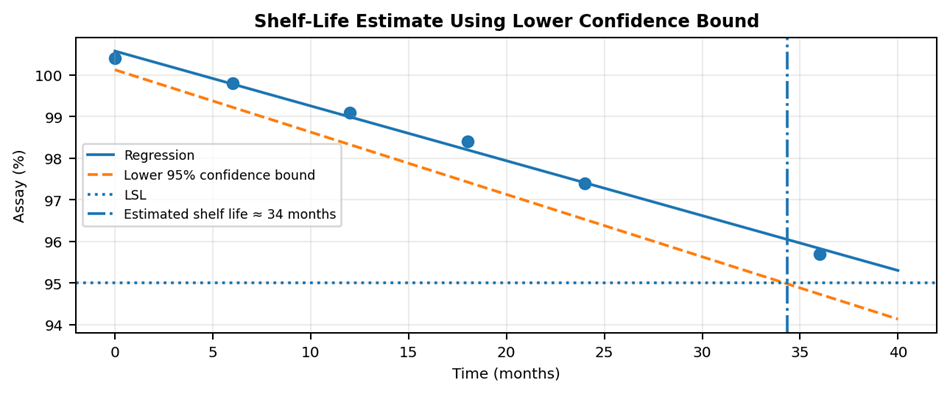
One of the most valuable applications of stability statistics is the estimation of shelf life.
ICH Q1E describes the use of regression analysis and confidence limits when evaluating quantitative stability attributes. Acquire the statistical tools required to support this type of evaluation.
Shelf-life estimation is not simply based on the point at which the fitted regression line intersects the specification limit. Statistical uncertainty surrounding the estimated trend must also be considered.
Depending on the direction of concern, the appropriate confidence bound can be evaluated against the specification. For a characteristic that decreases with time, such as assay, the lower confidence bound may be the critical boundary. For a characteristic that increases with time, such as a degradation product, the upper confidence bound may be the critical boundary. The estimated shelf life is associated with the point at which the relevant statistical confidence boundary reaches the acceptance criterion. This provides a more conservative and statistically defensible assessment than extrapolating the regression line alone.
Confidence Limits and Confidence Bands
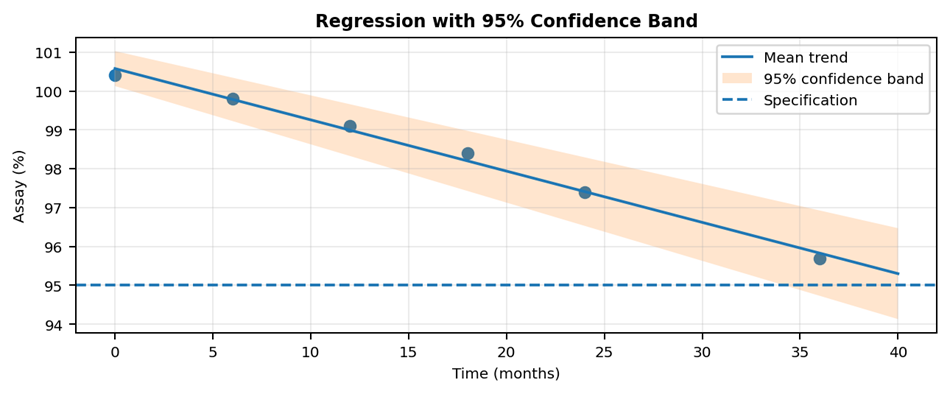
Every statistical prediction contains uncertainty. Two stability studies containing similar results may produce different levels of confidence depending on the number of observations, variability of the data, number of batches, and duration of the study.
Your software should present the fitted trend together with statistical confidence limits, allowing the scientist to see both the expected trend and the uncertainty surrounding that trend. This is particularly valuable when evaluating data close to a specification limit.
A regression line may appear to remain comfortably within specification, while the corresponding confidence boundary approaches the limit considerably earlier. The confidence interval therefore provides important information that cannot be obtained by reviewing the regression line alone. Graphical presentation of the regression model, observed results, specification limits, and confidence boundaries also makes complex statistical information easier to interpret and communicate during stability review.
Batch-to-Batch Comparison and Poolability
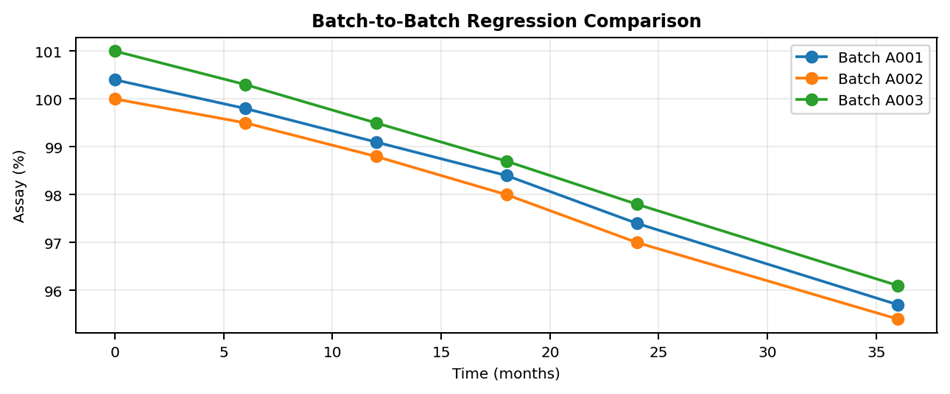
Commercial stability programs normally contain multiple production batches. Before combining data from those batches into a single statistical model, it is important to determine whether the batches demonstrate sufficiently similar stability behavior.
ICH Q1E describes a statistical approach for evaluating whether stability data from multiple batches may be combined. Support this evaluation through statistical comparison of regression models and analysis of batch-related effects. The assessment considers whether there are meaningful differences between the batches, including differences in the estimated slopes and intercepts.
Conceptually, the process asks two questions:
<strong>1.</strong> Are the rates of change comparable between batches?
<strong>2.</strong> Are the overall levels of the measured attribute sufficiently comparable to justify a common model?
Analysis of variance and related regression comparisons can be used to assess these effects.
Where the statistical evaluation supports pooling, the batches can be evaluated using a common model. Combining appropriate datasets can provide a stronger estimate of the overall stability trend because the analysis is based on a larger amount of information.
Where pooling is not statistically justified, the batches should remain independently evaluated. This distinction is important. The purpose of statistical pooling is not to produce a more favorable shelf-life estimate; it is to determine whether a common statistical model appropriately represents the available data.
Analysis of Variance
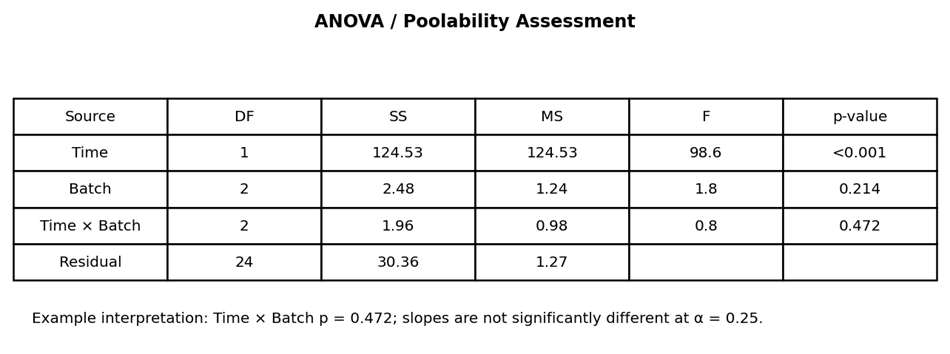
Analysis of variance, or ANOVA, is an important component of stability-data evaluation when multiple batches are involved. ANOVA-based approaches can help determine whether apparent differences between batches are likely to represent meaningful differences rather than ordinary analytical or manufacturing variability.
Within an ICH Q1E-style evaluation, the statistical analysis may examine the significance of differences in slopes and intercepts among batches. If the slopes are sufficiently similar, the data may support use of a common slope. Additional evaluation can then determine whether intercept differences permit further pooling. This structured approach provides a scientifically defensible method for deciding how multiple batches should be represented in the stability model.
Individual and Pooled Shelf-Life Evaluation
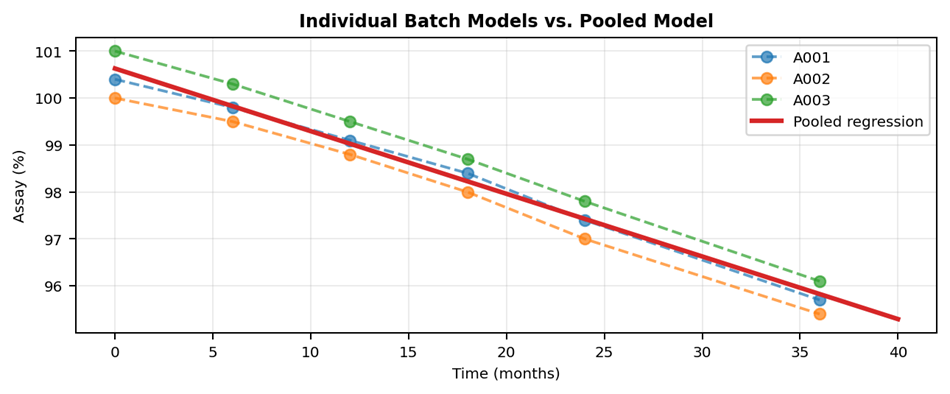
The ability to evaluate both individual batches and pooled datasets is particularly valuable.
Individual batch analysis can identify a batch demonstrating a different degradation pattern from the remaining batches. Pooled analysis, when statistically justified, provides an overall representation of product stability.
The two perspectives complement each other.
A stability scientist can review individual batch behavior, investigate potential differences, determine whether pooling is appropriate, and then assess the resulting shelf-life estimate.
This avoids automatically combining data that may represent different stability populations.
Share This Article with the Stability Community!
October 9, 2026

Let’s take a look at the evolution of environmental chamber monitoring systems. Are you fully evolved and up to date with the latest technology, [...]
June 28, 2026

Foreword by John O’Neill: An accelerated stability failure is not always the end of a product's story but how a failure episode concludes can [...]
May 2, 2026

From conception to destruction, there are numerous CGMPs governing the life cycle of a sample, with multiple professionals, departments and organizations having a hand in [...]
Share your questions and experiences
A stabilitarian encounters new situations every day. StabilityHub’s discussion forums give Stabilitarians an opportunity to ask questions and offer solutions to specific scenarios. Join in the conversations with other Stabilitiarians and share your knowledge!
A stabilitarian encounters new situations every day. StabilityHub’s discussion forums give Stabilitarians an opportunity to ask questions and offer solutions to specific scenarios. Join in the conversations with other Stabilitiarians and share your knowledge!
